How to Measure the ROI of Card-Linked Offers: A Practical Guide
Redemptions are easy to count. Real return is harder. This guide shows banks and merchants how to measure what offers actually change.
One of the biggest advantages of card-linked offers is that they are measurable. Every view, save and redemption can be recorded. But measurable is not the same as measured well. A dashboard full of redemption counts can still leave the most important question unanswered: did the offer change anything?
This guide sets out a practical approach to measuring return on investment for both banks and merchants.
Start with the objective
Before you measure anything, be clear about what the programme or campaign is meant to achieve. Different goals need different metrics.
- Card activation: getting new or dormant cards used.
- Frequency: encouraging more transactions per active card.
- Share of wallet: moving spend from competitor cards to yours.
- Retention: reducing closures and long-term dormancy.
- Merchant growth: bringing new or off-peak customers to merchants.
Pick one or two primary objectives per campaign. Trying to prove everything at once usually proves nothing.
The metrics that matter
Funnel metrics
These tell you whether customers are engaging with the programme at all.
- Reach: how many eligible cardholders saw offers.
- Engagement: views, saves and clicks per active user.
- Redemption rate: redemptions divided by customers who saw the offer.
Funnel metrics are useful for optimising the experience, but they do not prove value on their own.
Outcome metrics
These tell you whether behaviour changed.
- Active card rate among engaged versus non-engaged customers.
- Spend per card before and after, and against a control group.
- New-to-merchant customers: how many redeemers had never visited that merchant before.
- Repeat visits at full price after the first offer redemption.
Economic metrics
These connect behaviour to money.
- Incremental spend attributable to the offer.
- Cost per incremental transaction, including any bank-funded contribution and platform costs.
- Merchant return: incremental revenue compared with the value of the discount given.
Incrementality: the heart of ROI
The hardest and most important question is incrementality. Some customers who redeem an offer would have visited the merchant anyway. Counting their spend as "generated" by the offer overstates results.
Use control groups
The cleanest method is a holdout. Randomly select a small share of eligible cardholders, for example 10%, who do not see a particular offer or campaign. Compare their behaviour with those who do.
- If the exposed group spends noticeably more in the category or at the merchant, the difference is your incremental effect.
- Keep the holdout random and stable for the campaign's duration.
- Make sure the groups are large enough for the difference to be meaningful.
Compare before and after, carefully
When a holdout is not possible, compare behaviour before and after the offer, but adjust for seasonality. Spend naturally rises around Ramadan, Eid, summer travel and year-end. A rise during those periods is not automatically caused by your offer.
Watch for cannibalisation
A generous offer on a customer's usual Tuesday coffee may simply discount a visit that would have happened anyway. Look at whether redeemers are new, lapsed or regular customers.
A simple worked example
Imagine a hypothetical dining campaign run for four weeks:
- 40,000 cardholders were eligible; 4,000 were randomly held out.
- In the exposed group, 6% visited participating restaurants during the campaign.
- In the holdout group, 4% visited the same restaurants in the same period.
The 2-point difference is the incremental effect. Measuring 6% on its own would have tripled the apparent impact compared with the true uplift. That is why holdouts matter.
This example is illustrative. Actual results vary widely by market, category and offer design.
What merchants need to see
Merchants care about a smaller set of questions:
- How many new customers did this offer bring?
- Did they spend more than the value of the offer?
- Did they come back?
- Which days and times worked best?
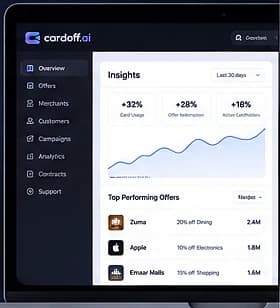
A good merchant dashboard answers these in plain language, without requiring the merchant to export data or understand statistical methods. When merchants can see value, they renew and improve their offers.
Building a reporting rhythm
- Weekly: funnel metrics and redemptions by offer, to spot issues fast.
- Monthly: outcome metrics by segment and category, plus merchant performance.
- Quarterly: incrementality results from holdout tests and an overall programme ROI review.
Share a one-page summary with business leaders. Most executives do not need every chart; they need to know what is working, what is not, and what you will change.
Common measurement mistakes
- Counting redemptions as success. Redemptions are an input, not an outcome.
- Ignoring the control group. Without one, results are almost always overstated.
- Changing too much at once. If targeting, offers and messaging all change in the same week, you cannot tell what worked.
- Forgetting the merchant side. A programme that works for the bank but not for merchants will shrink.
Making measurement easy
The best measurement framework is one that runs automatically. That means clean event data, built-in holdout options and reports designed for each audience.
cardoff.ai records every offer view and redemption, supports control groups for campaigns, and gives banks and merchants their own clear dashboards. If you want to know what your offers are really achieving, we would be glad to show you how the reporting works.